 FarmMind
FarmMind
FarmMind

It's been a few weeks since our last update, but we haven't slowed down one bit. We've been heads-down building, and this is one of our biggest releases yet.
This update brings a full-blown Chemistry Manager, a polished View Mode for all your documents, dropdown selections for field notes, multi-polygon field support, smarter map overlays, document markers on the map, and a whole lot more across the platform. A lot of what you'll see below came directly from your feedback, and we highly encourage you to keep it coming.
Questions, feature requests, or just want to chat about anything FarmMind-related? Reach out to us at support@farmmind.org. We read every message.
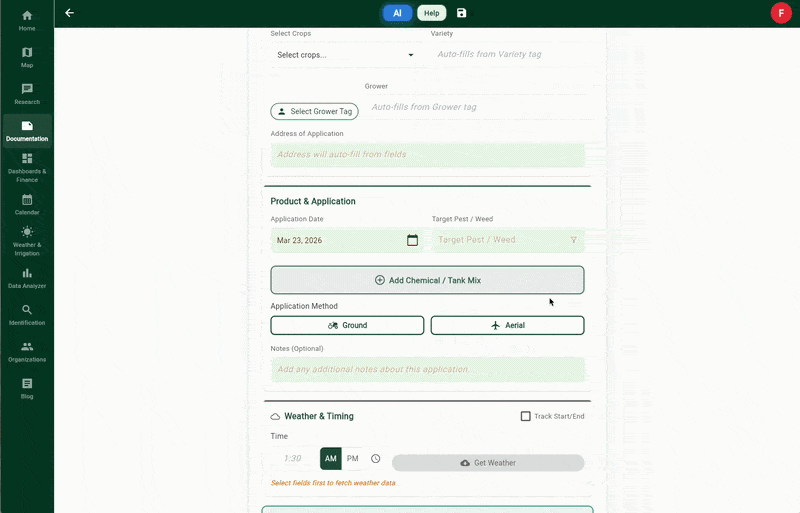
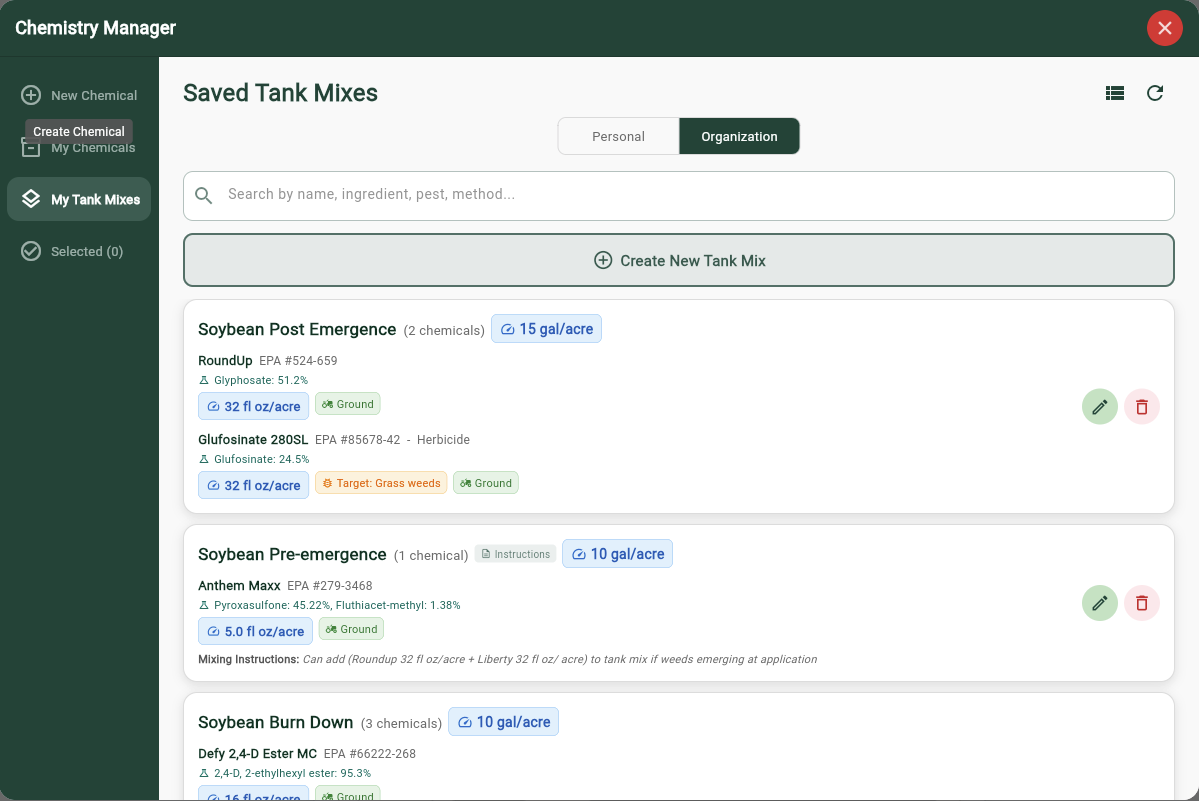
Managing crop protection products just got a whole lot easier. The new Chemistry Manager is a powerful, all-in-one workspace for creating, organizing, and applying chemicals and tank mixes, right inside FarmMind.
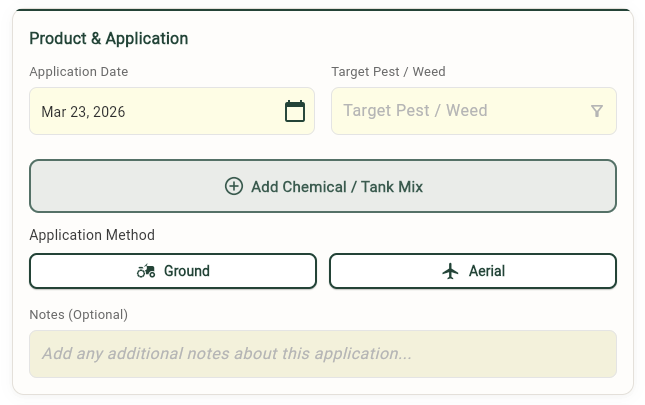
No more re-entering the same product information over and over. Build a personal chemical library with all the details that matter: product name, EPA registration number, active ingredients, rate, target pest, application method, REI, rainfast period, and more. Save chemicals to your personal collection or share them across your entire organization.
Create and save your go-to tank mixes with full mixing order, per-chemical rates, mixing instructions, and tank rate. Need to add a chemical? Jump into your library, pick what you need, and it's added instantly. Drag to reorder, set instructions, and save. Your mixes are ready to use whenever you need them.
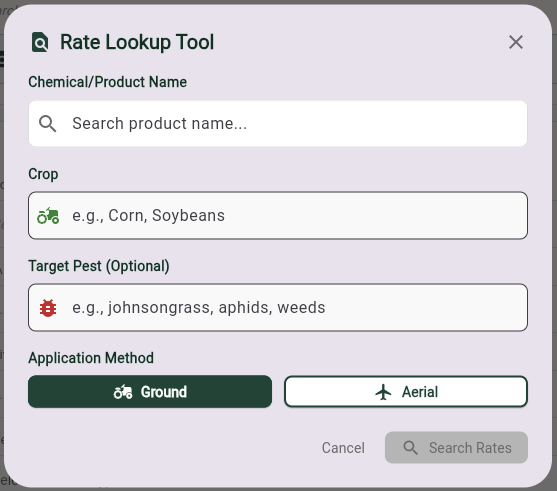
Not sure about the label rate? The integrated EPA rate lookup lets you search by product name and auto-fill rate, rainfast, and registration details directly from the label. No switching between apps or digging through paperwork.
Your most recently used chemicals and mixes surface at the top automatically. A 15-minute smart cache keeps things snappy, and full offline support means you can work from the field without a connection. When you're back online, everything syncs up.
The Chemistry Manager plugs directly into Recommendations, Application Records, and Field Notes. Select your chemicals, close the manager, and they appear in your document, complete with all metadata, ready for export to PDF.
Save chemicals and tank mixes to your organization's shared library so your whole team works from the same playbook. Consistent product data across every document, every time.
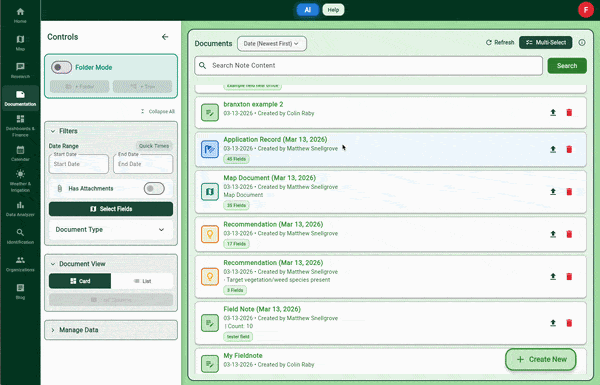
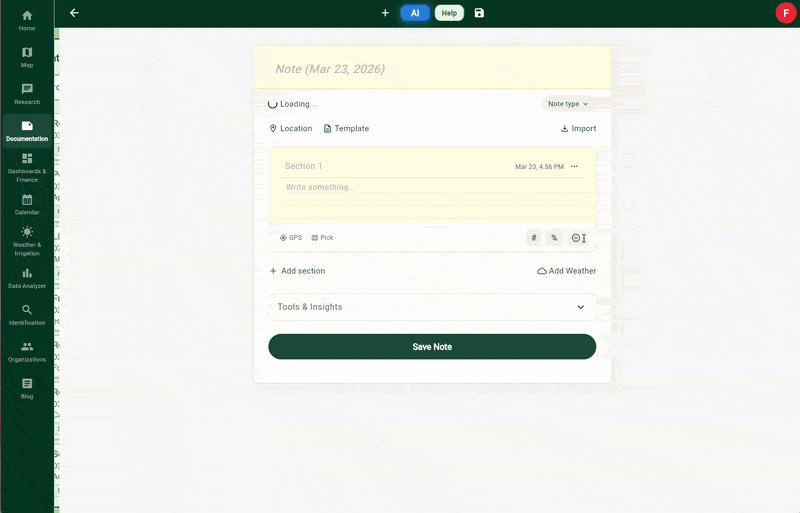
Hit save on any document and it snaps into a clean, read-only View Mode, a polished, print-ready layout of your Recommendations, Application Records, Field Notes, and Map Documents.
Add your company name, license number, address, and contact info. Create and manage multiple header templates, and auto-fill grower and farm details from your field tags.
Toggle on your saved signature and it drops right into the document. Set it up once in your profile and it's available across every document.
Choose whether your map sits at the top or bottom of the document with a simple toggle. Your preference is saved per document.
Everything carries through to PDF export, so what you see in View Mode is what your client gets.
Field notes now support dropdown selections. No more typing the same options over and over.
Create reusable dropdown lists like "Weed Pressure" or "Growth Stage" with your own predefined options. Add them to any field note section on the fly, or bake them into templates so they're ready every time. Choose between single-select and multi-select, and save lists to your personal library or share them across your organization.
Fields are no longer limited to a single polygon. Multiple polygons can now be combined into, or more commonly imported as, a single field. This is especially useful for fields that are split by roads, waterways, or irregular boundaries but are managed as one unit. Multi-polygon fields work seamlessly across the platform: acreage calculations, overlays, documents, and the Data Analyzer all recognize and handle them correctly.
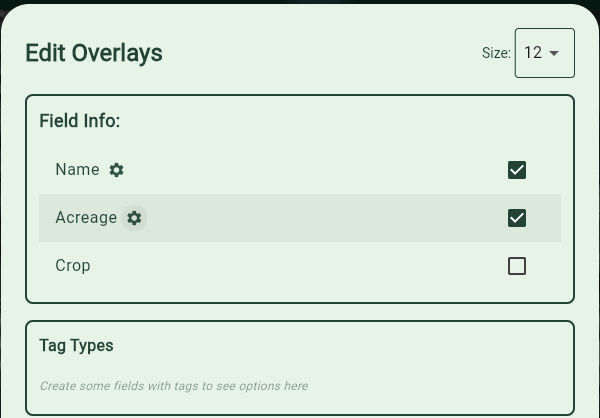
Field name and acreage labels on the map just got more flexible. You can now choose where they appear: at the field level, the zone level, or both.
Tap the gear icon next to Name or Acreage in your overlay options and pick your scope. Working with management zones? Switch to Zones Only to see labels on each zone without the field-level clutter. Need the big picture? Fields Only keeps it clean. Want everything? Fields & Zones shows both.
The setting works on the main map and in the map creator, and it's smart about it. If zones aren't active on a field, it falls back to field-level labels automatically so you never end up with a blank map.
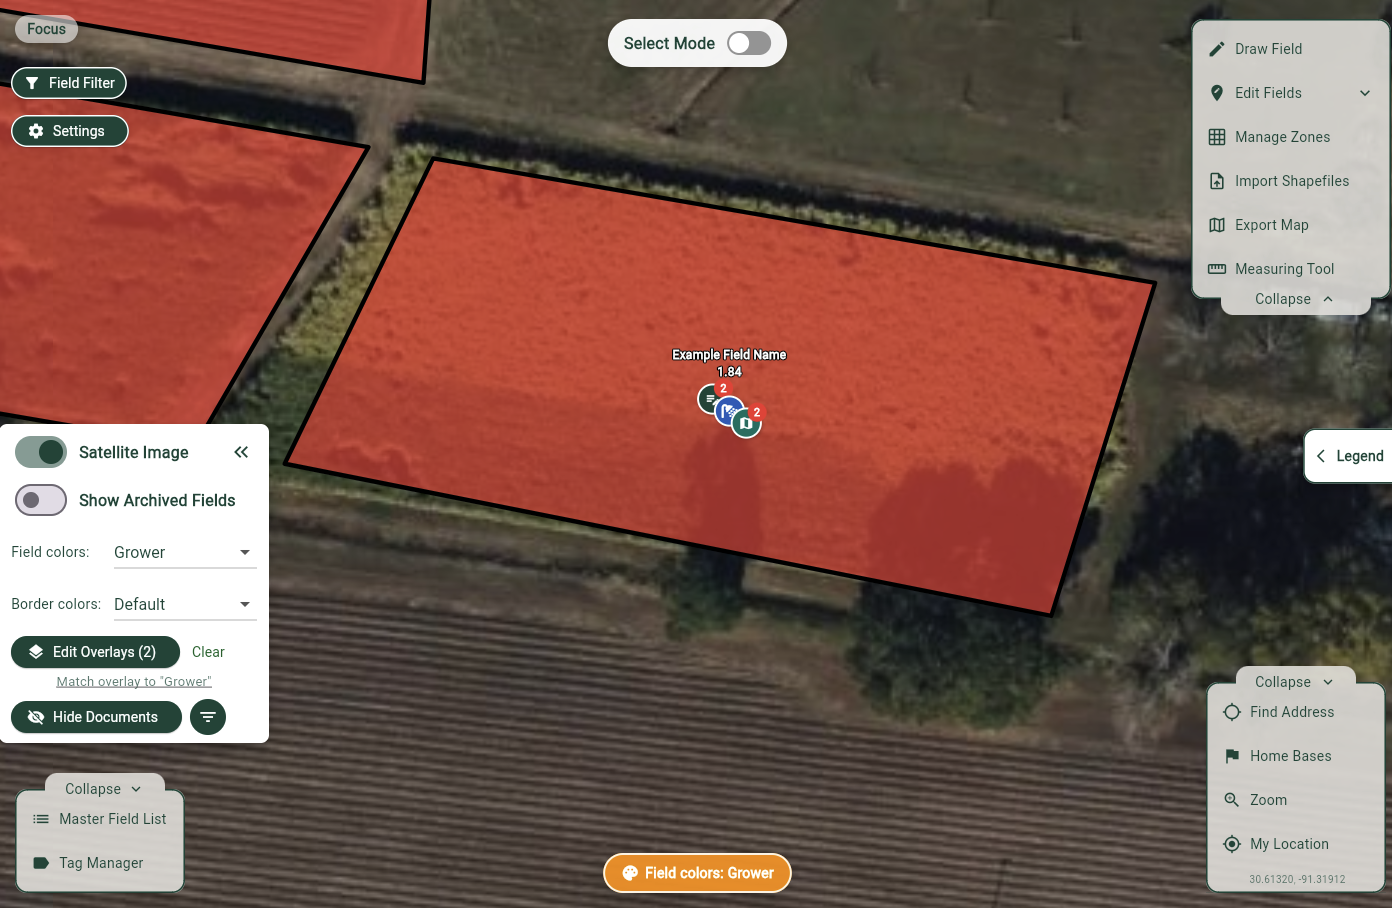
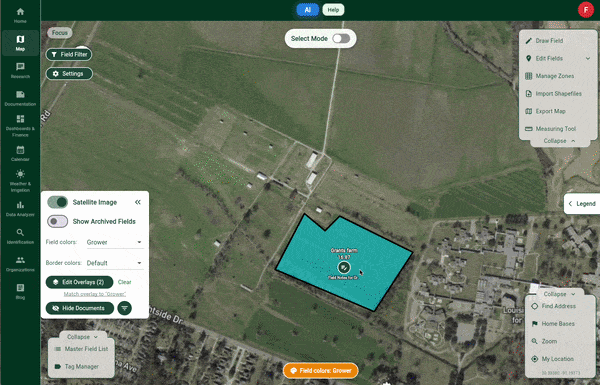
Ever wonder which fields have documents attached, without opening each one? Now you can see them right on the map.
Toggle "Show Documents" from Visual Tools and your fields light up with color-coded markers for every associated document: Field Notes, Recommendations, Application Records, Map Documents, Soil Tests, and Custom Documents. Each type gets its own icon and color so you can tell at a glance what's been recorded where.
Filter by date range, field, or document type to zero in on exactly what you need. Tap a marker to preview the document, or tap a stacked marker to browse all documents at that field grouped by type. Field Notes with GPS coordinates even pin to their exact location on the map.
Markers update in real time, scale with your zoom level, and respect your organization's permissions, so everyone sees exactly what they should.
Need to find your way to a field? Tap it on the map, hit "Directions", and your favorite maps app takes over. Google Maps, Apple Maps, Waze, if it's on your device, it'll show up as an option. On the web, it opens Google Maps automatically.
No copying coordinates, no switching apps. One tap and you're on your way.
The Data Analyser no longer limits you to one field at a time. Select multiple fields, and see all their data on a single map: heatmaps, soil tests, variable rate zones, and more, each rendered within its own field boundary.
Compare yield across five paddocks. View soil test results side by side. Generate variable rate fertilizer maps spanning your whole operation. No more switching between separate visualizations to get the full picture.
The analyser also now recognizes holes in fields: ponds, tree lines, buildings, or any internal cutouts are properly excluded from data rendering and acreage calculations, giving you cleaner, more accurate results.
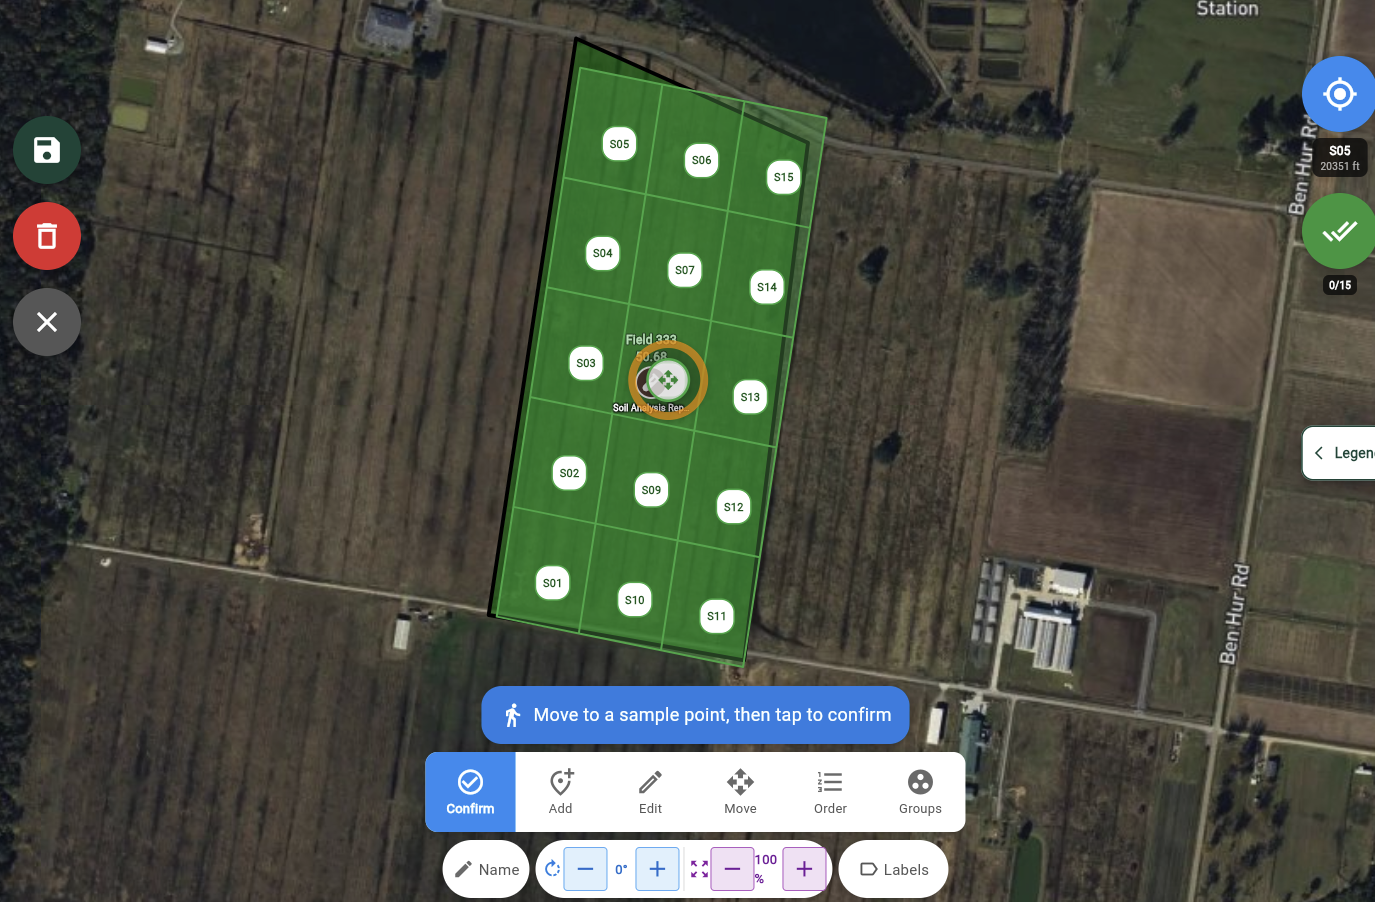
We've refined the soil testing workflow to be smoother and more intuitive across the board, including new support for multi-field composite sampling.
Your saved map locations are now drag-and-drop. Grab the handle and arrange your home bases in whatever order makes sense to you. Your preferred order syncs and sticks.
Zones got a platform-wide upgrade. Give your zones custom names and see them flow through everywhere: map overlays, recommendations, application records, field notes, and exports. When zones manage a property like Variety or Grower, documents automatically pull from zone-level data instead of field-level tags. Less manual entry, more accuracy.
Under the hood, we've overhauled how operations data gets turned into heatmaps. A new interpolation engine with scanline masking and optimized color rendering makes yield and pesticide application maps generate significantly faster, especially across multiple fields. Time-variant snapshots now render correctly too, so your historical data stays sharp.
We've squashed various bugs and made usability improvements throughout the platform based on your feedback. A big shoutout and thank you to everyone who reported them. You're helping make FarmMind better for the whole community.
Here's a sneak peek at what we're working on:
...and much more. Have something you'd like to see? Shoot us a quick message and let us know!

Over the last month, the Farm Mind team has received some frequently asked questions.

Baton Rouge, La., August 6, 2025 – FarmSmarter.ai, the Louisiana startup turning cutt

This week's update is packed with improvements across the entire plat