
Field DashboardsVisualize Metrics, Maximize Profitability
Three Types of Dashboards
Season Dashboard
One field, one season—track yield, costs, weather, field notes, and financial metrics in a single comprehensive view.
Season Comparison
Compare multiple seasons for one field side-by-side. Analyze crop rotation, financial trends, and performance over time.
Field Comparison
Manage thousands of fields at once. Add costs and yield data to multiple fields and compare metrics across your entire operation.
Season Dashboard: Everything in One Place
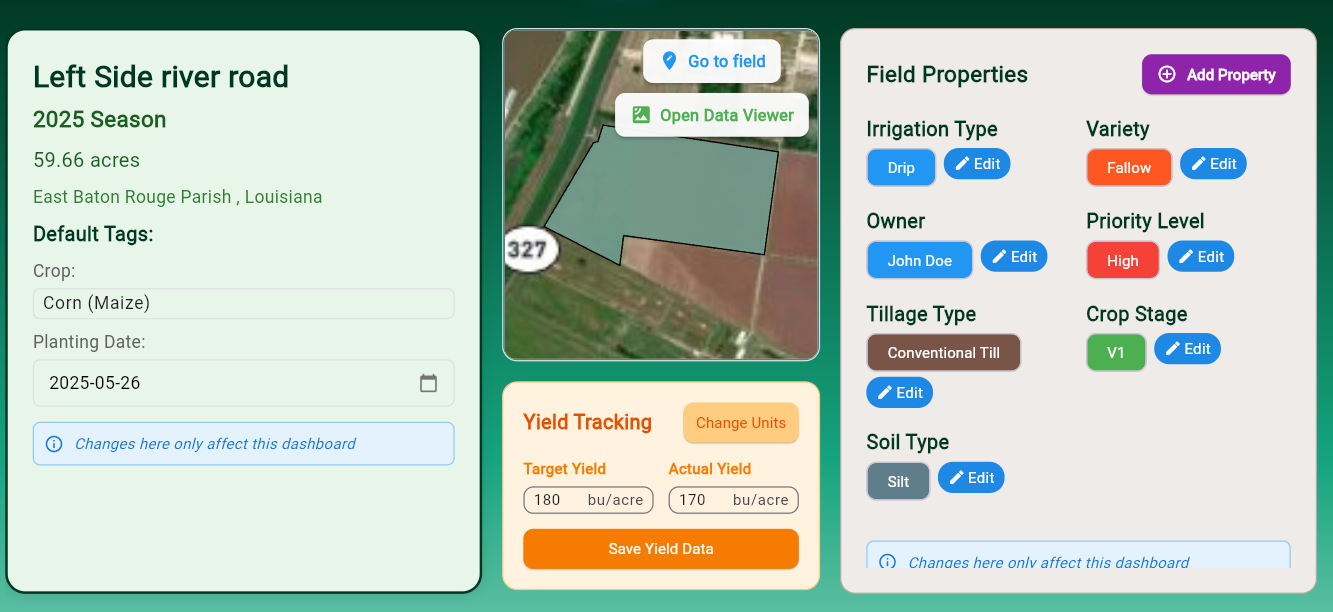
The season dashboard organizes all information about a single field for a single season. From yield tracking to weather analysis, it's your command center.
▸See Master Field Timeline
Field Properties & Yield
- ▸Track variety, crop, and tags season-by-season
- ▸Input target and actual yield for accurate analysis
- ▸Auto-populated with local average data
- ▸Yield directly affects financial calculations
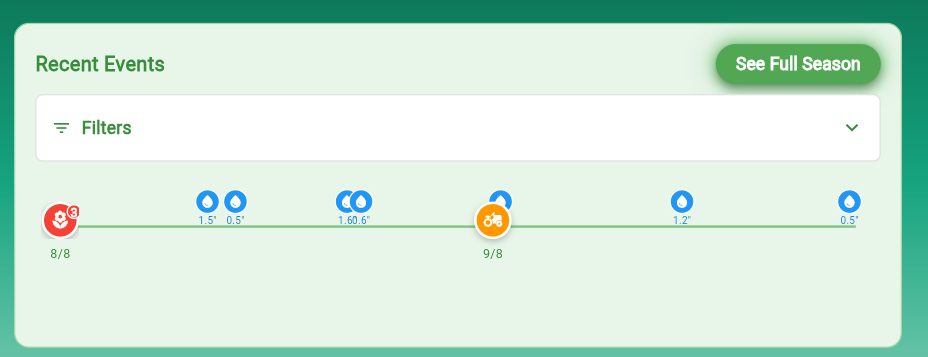
Master Field Timeline
- ▸View all rain events and field notes in chronological order
- ▸Filter by event type and set rain thresholds
- ▸See exactly when observations were made
- ▸Connect field activity to weather patterns
Comparison Dashboards
Compare across seasons or across fields to identify trends, anomalies, and optimization opportunities.
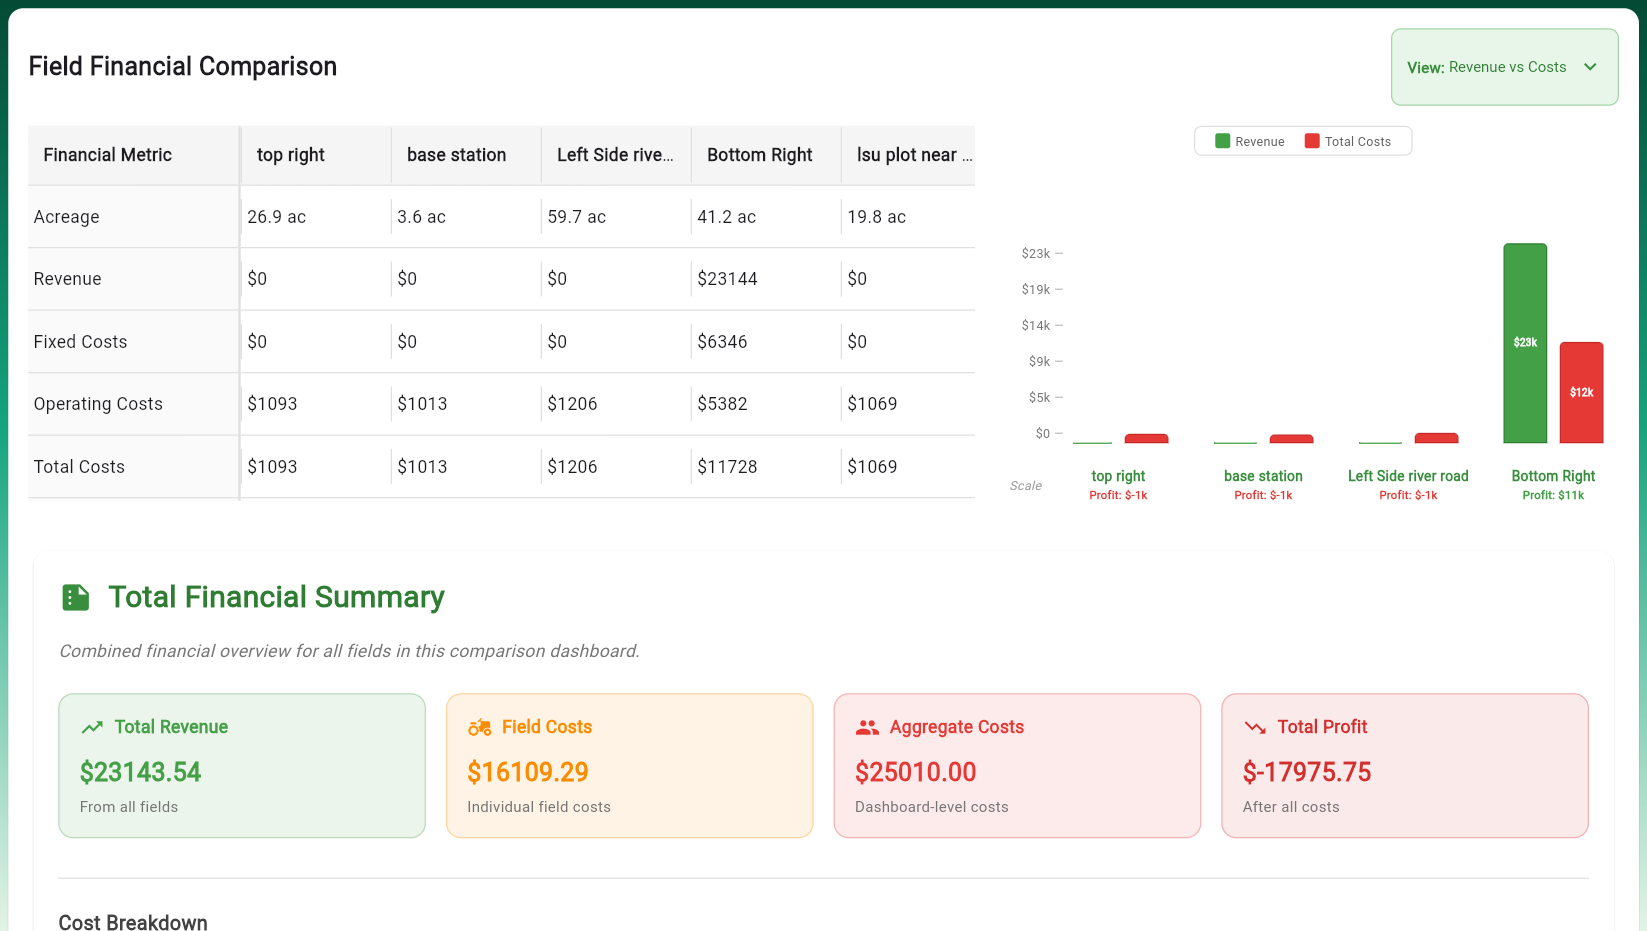
Field Comparison
Manage thousands of fields at once. Add cost and yield data to multiple fields simultaneously and compare metrics across your entire operation.
▸See Field Comparison Dashboard
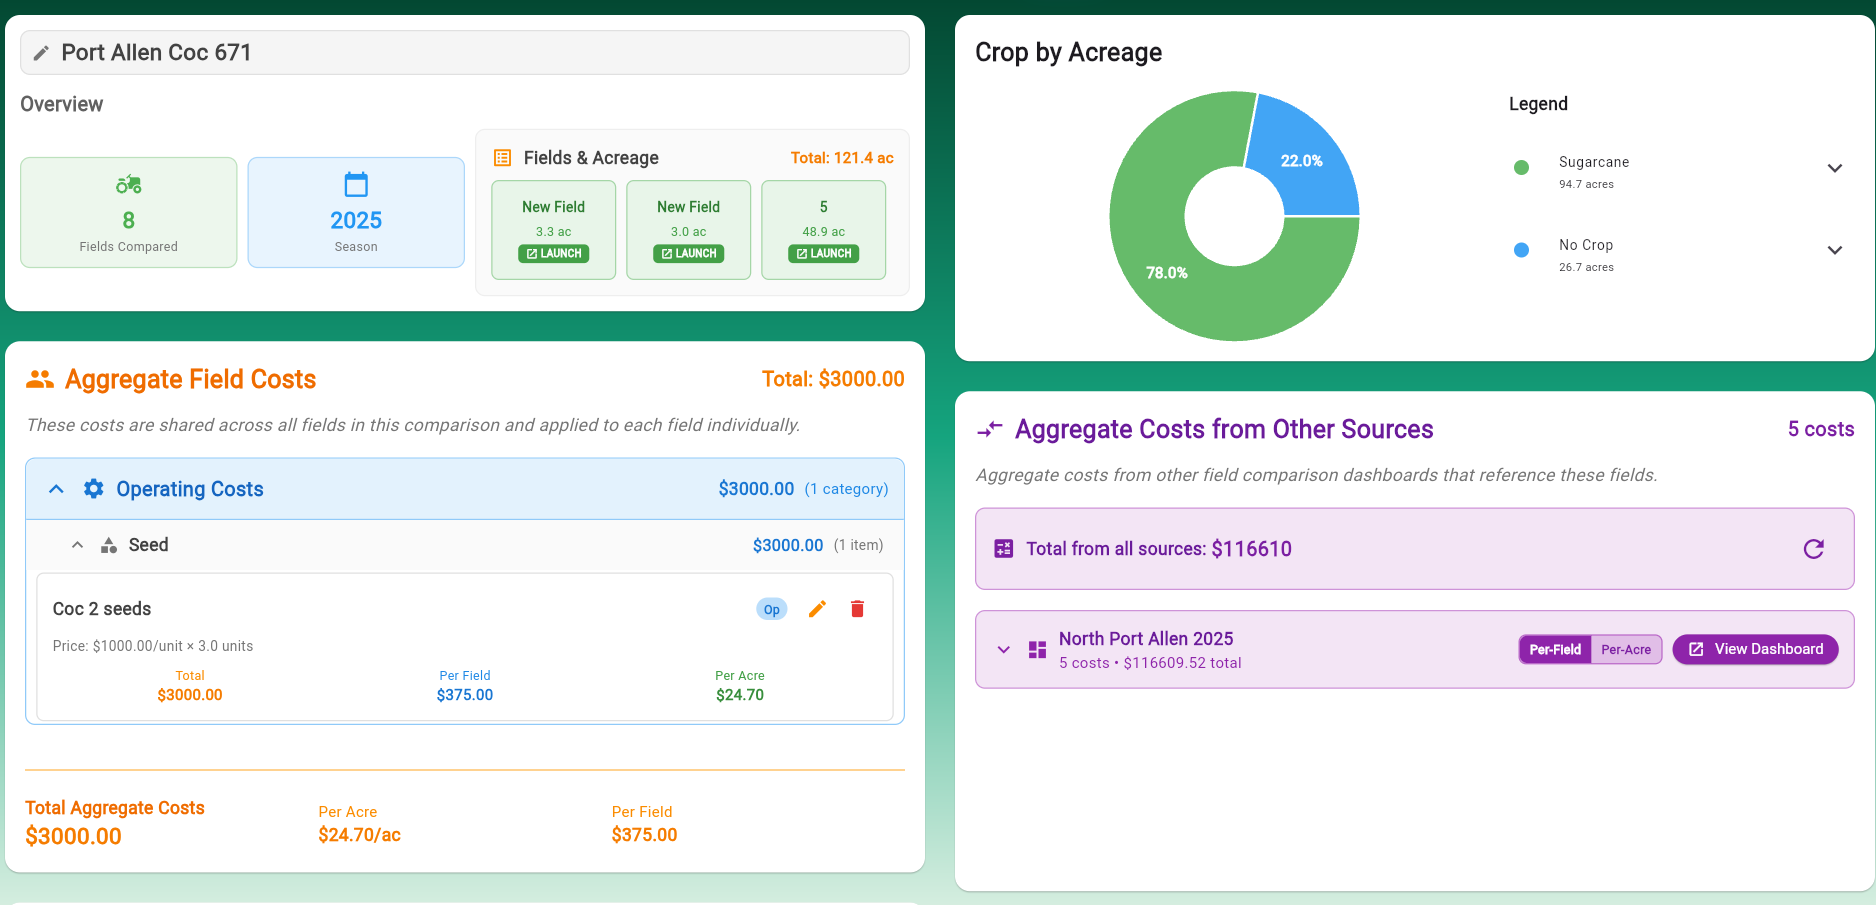
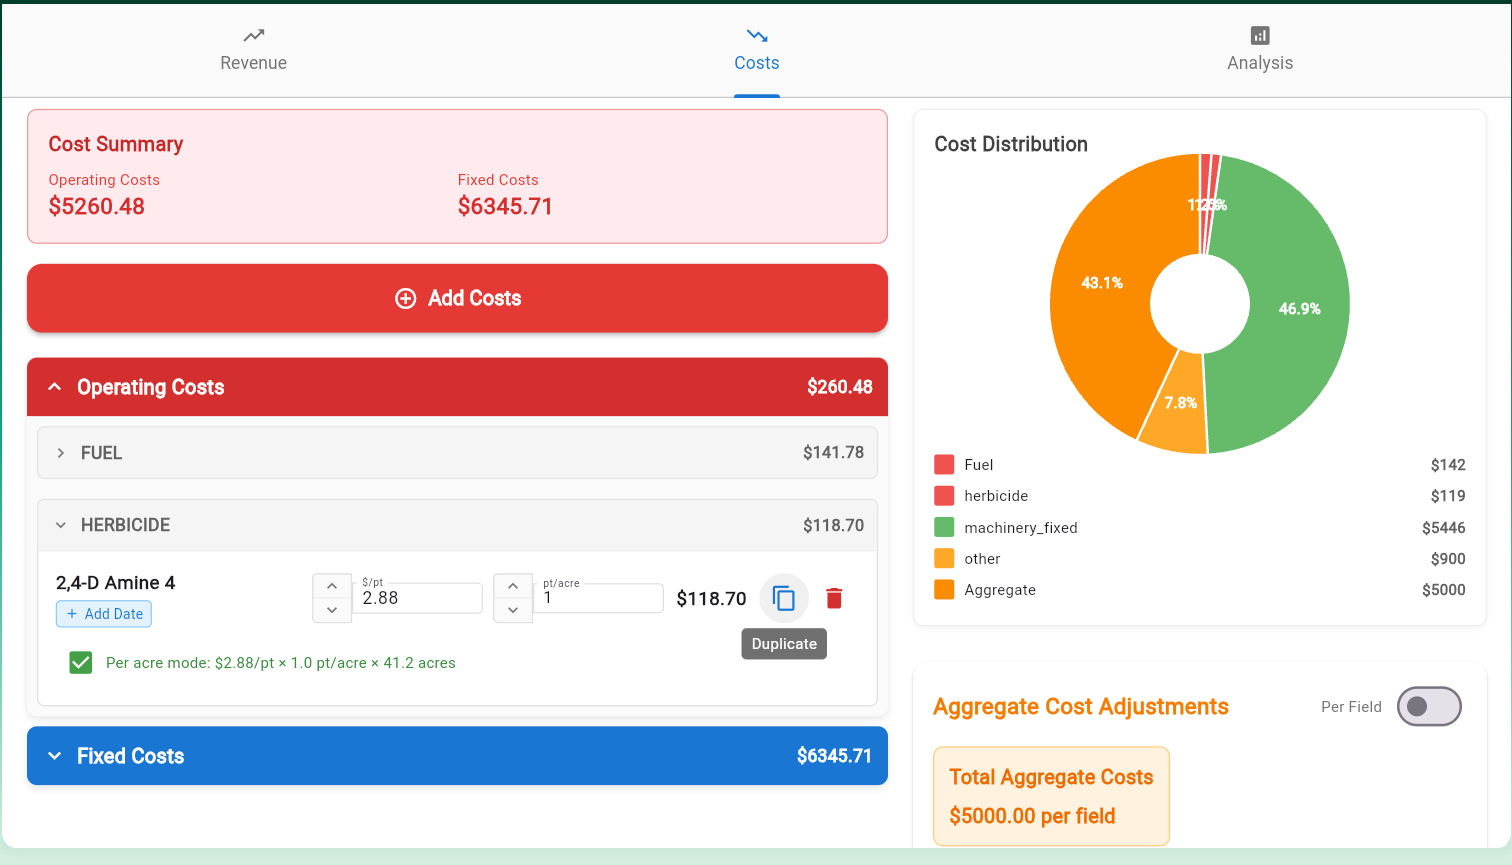
- ▸Add costs/yield to thousands of fields at once
- ▸Aggregate costs, per-acre costs, or per-field costs
- ▸View crop distribution by acreage
- ▸Side-by-side field cost and revenue comparisons
- ▸Cost breakdown categorized by operating/fixed costs
Season Comparison
Select one field and view all seasons side-by-side. See crop rotation, financial trends, cost breakdowns, and AI analysis across multiple years.
▸See Season Comparison Example
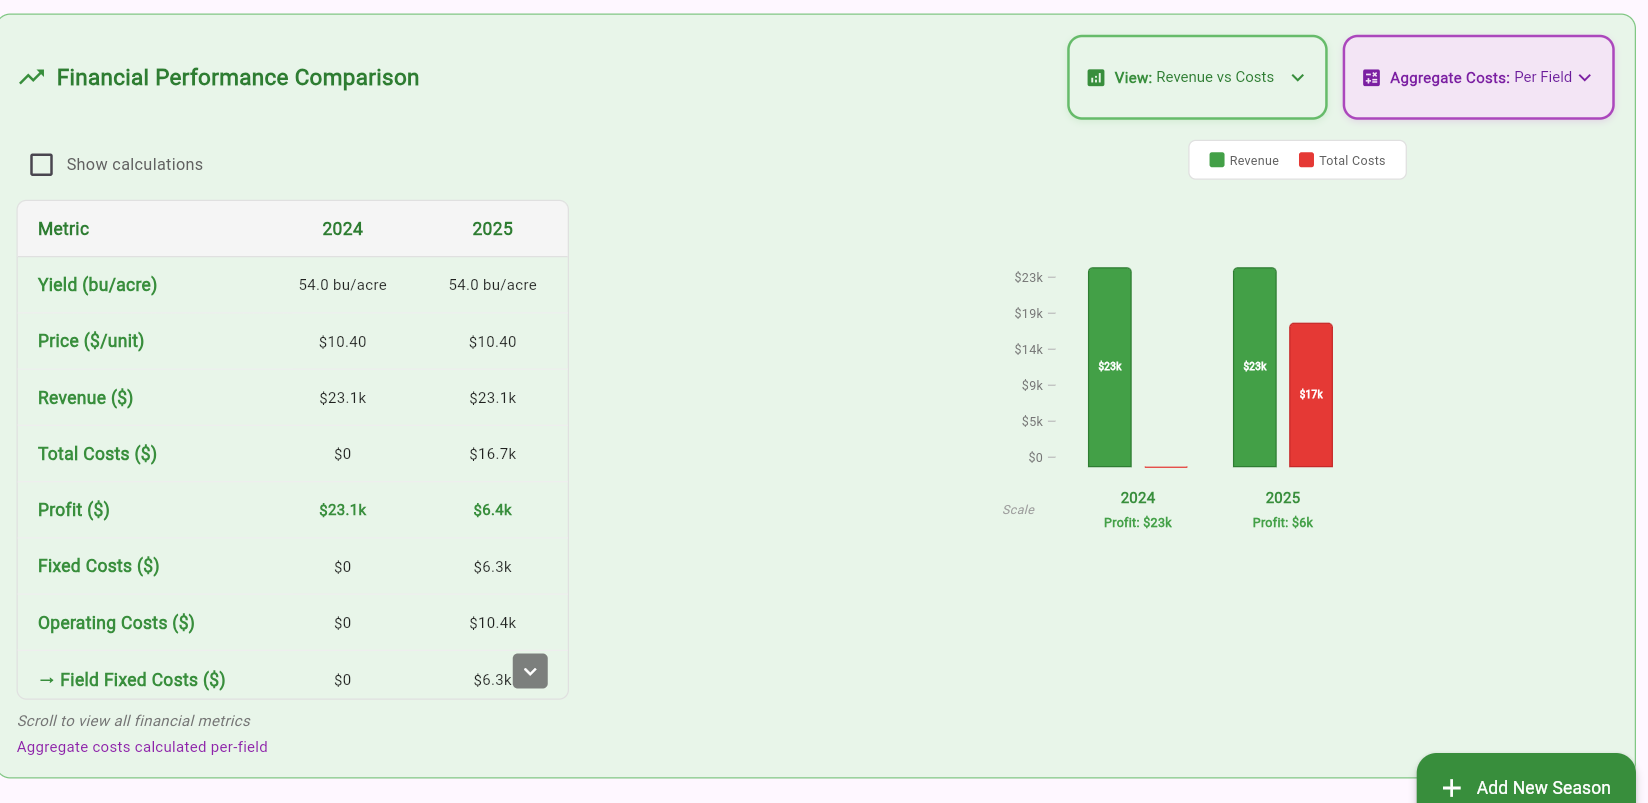
- ▸View crop rotation timeline
- ▸Compare financial metrics season-by-season
- ▸Analyze cost changes over time
- ▸AI economic analysis across all seasons
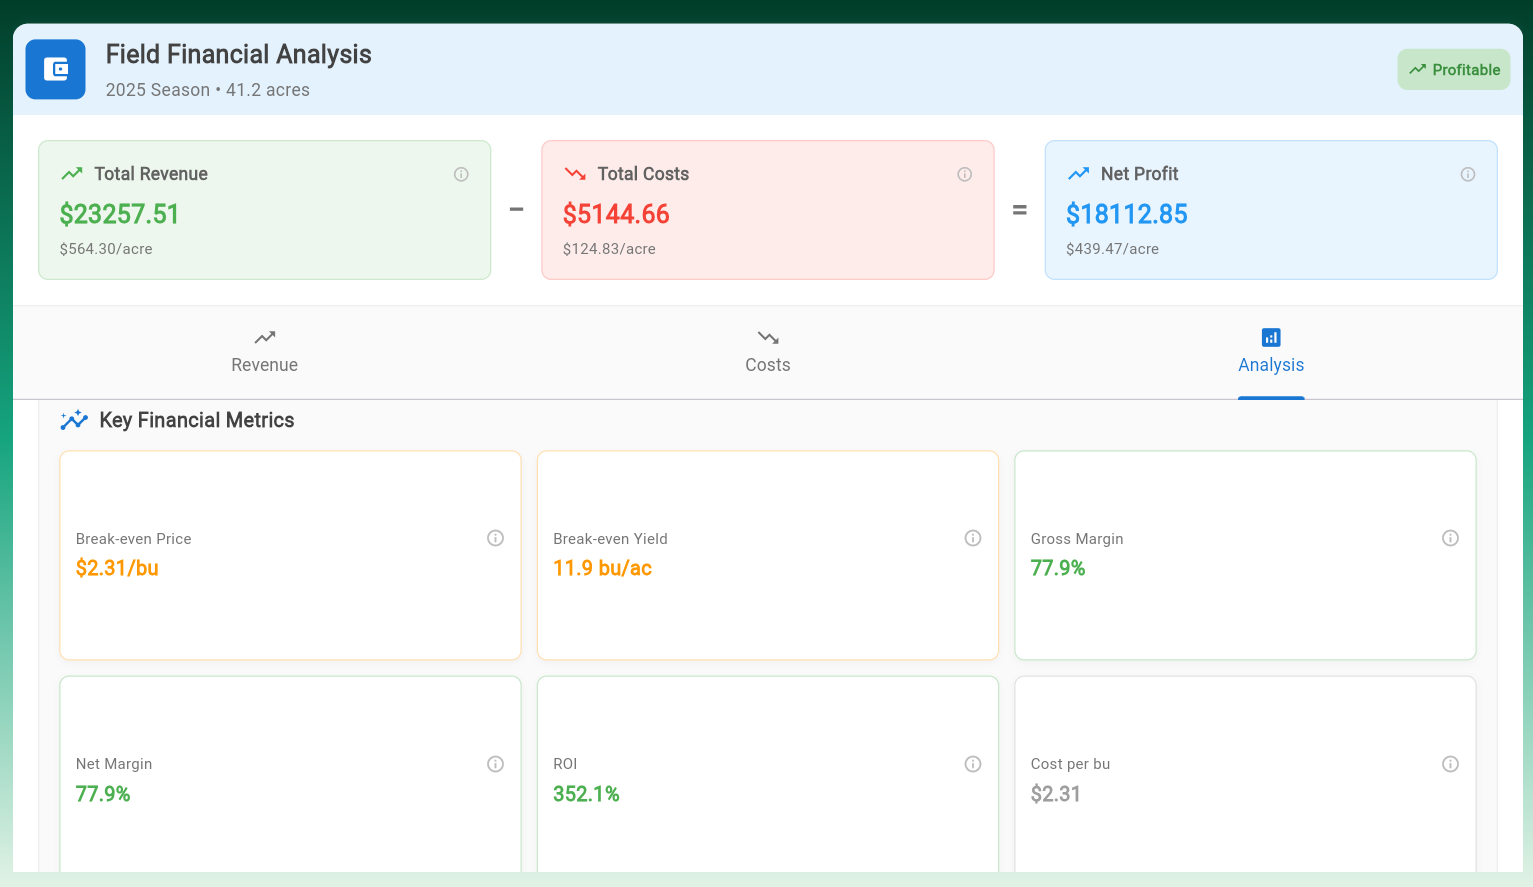
Field Balance Sheet
The core of your field finances. Track revenue, costs, and analysis all in one place with automatic calculations and AI-powered insights.
▸See Balance Sheet Example
Revenue
Enter cash price per unit and revenue is automatically calculated based on actual yield and field acreage.
Costs
Add per-acre or flat costs. Track pesticides, labor, equipment—anything. Specify application rates and quantities.
Analysis
View ROI, margins, breakeven, and more. Use AI to identify anomalies and find opportunities to save money.
AI Economic Analysis
Press "Analyze with AI" to identify cost anomalies, suggest optimizations, and provide insights to increase your bottom line.
Weather, Growth, Soil & Elevation Analysis
Four comprehensive analysis tabs provide deep insights into environmental factors affecting your field.
Weather Analysis
View precipitation, temperature, wind speed/direction, predicted soil moisture, and historical weather patterns.
Growth Analysis
Predict current growth stage by calculating Growth Degree Units (GDUs) using temperature data and thresholds.
Soil Analysis
AI models automatically predict soil composition for your field based on geospatial data.
Elevation Analysis
USGS data provides max/min elevation and topographical insights throughout your field.
Farm Futures Analysis
Track futures prices for different contracts and commodities. Compare breakeven to market prices and calculate basis automatically.
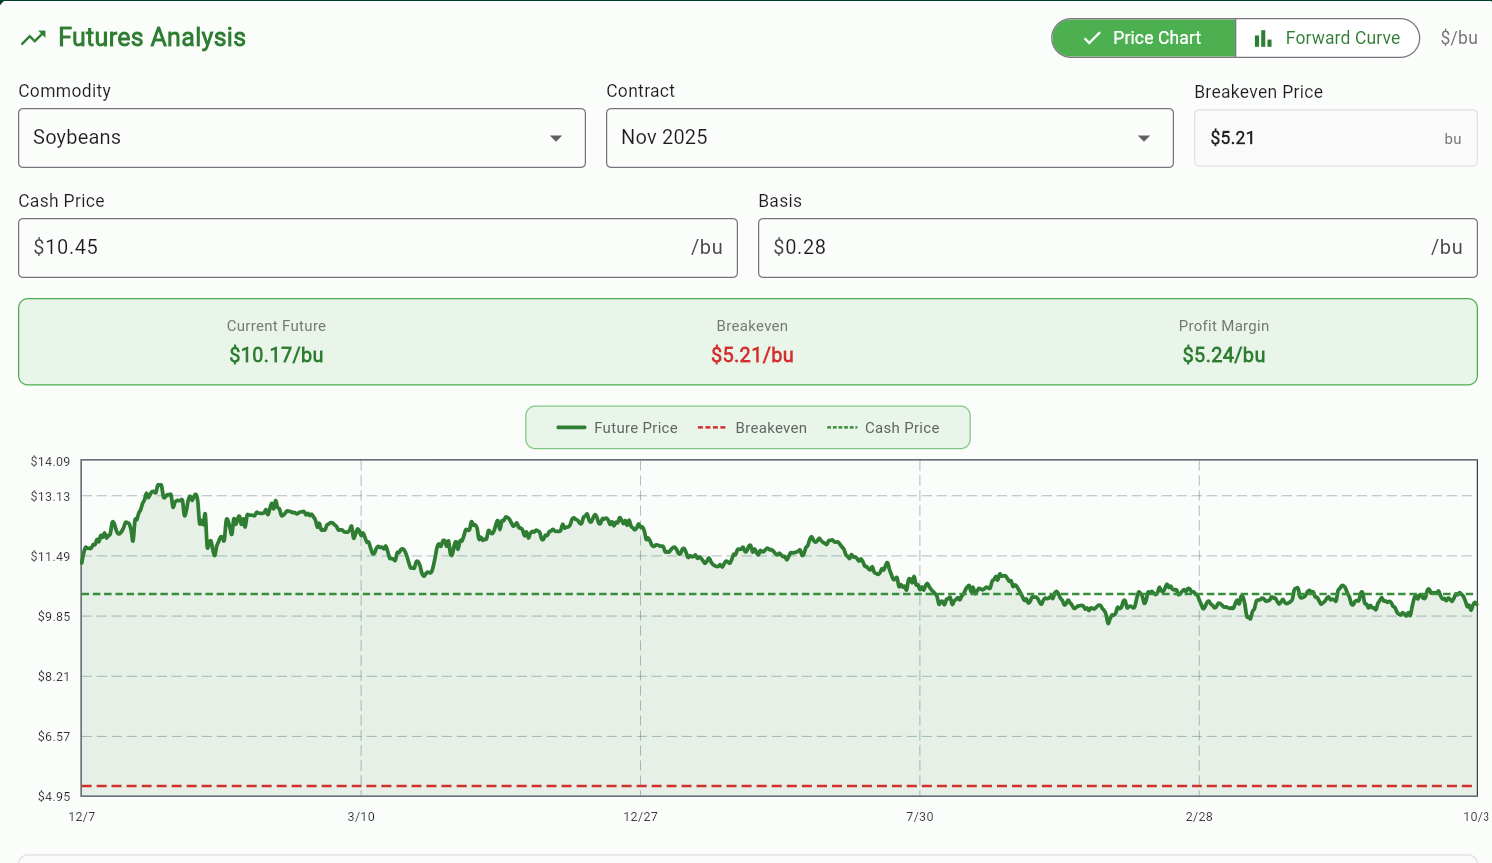
- →View futures prices over time for active contracts
- →Cash price automatically pulled from balance sheet
- →Basis calculated from futures and cash prices
- →Breakeven shown as dotted line for easy comparison
- →Forward curve view to compare different contracts
Yield Comparison Across Fields and Seasons
Compare target vs. actual yield per acre and total yield across multiple fields and seasons. Identify underperforming fields and track yield trends over time.
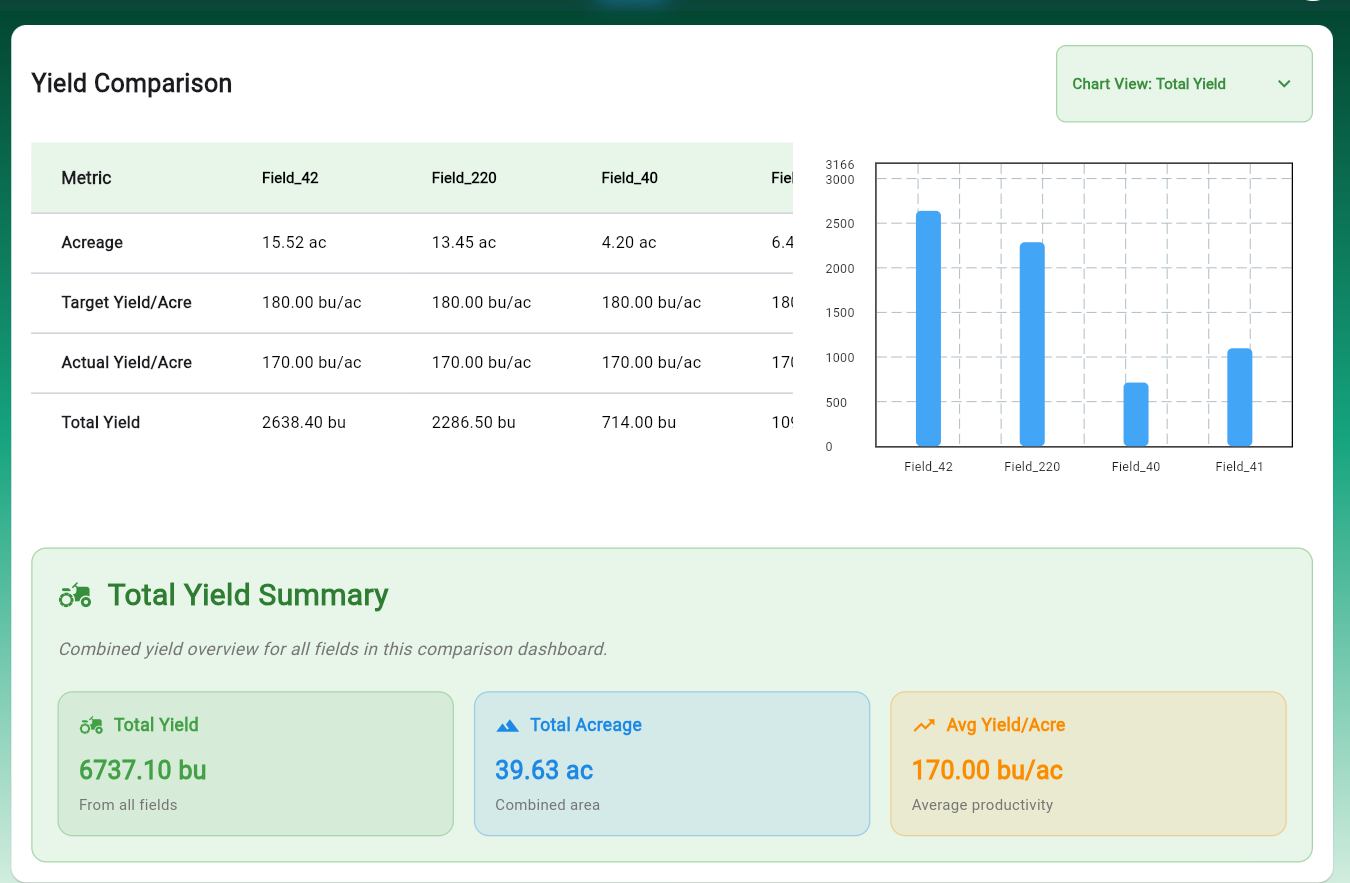
Target vs. Actual Yield
- ▸Compare projected yield against actual harvest data
- ▸Identify fields that exceeded or fell short of expectations
- ▸View yield per acre and total yield side by side
Multi-Season & Multi-Field Analysis
- ▸Compare yield across hundreds or thousands of fields at once
- ▸Track yield performance season over season
- ▸Spot trends and anomalies in field performance
Solving Organizational Nightmares
Imagine you're managing 4,000 fields and a new disease appears. How do you calculate the cost of fungicide application for each client and analyze the impact on their bottom line?
Without FarmMind:
- ✗Calculate acreage for thousands of fields manually
- ✗Apply labor and product costs client-by-client
- ✗Recalculate breakeven, ROI, margins for each field
- ✗Organize endless spreadsheets
With FarmMind:
- ✓Select all affected fields with a click
- ✓Add fungicide cost once for all fields
- ✓View updated ROI, margins, and analysis instantly
- ✓Make informed decisions in minutes, not days
Ready to Visualize Your Farm's Finances?
Stop wasting time on spreadsheets. Start making data-driven decisions.
Get Started Free