
FarmMind Tutorials
Season Dashboards
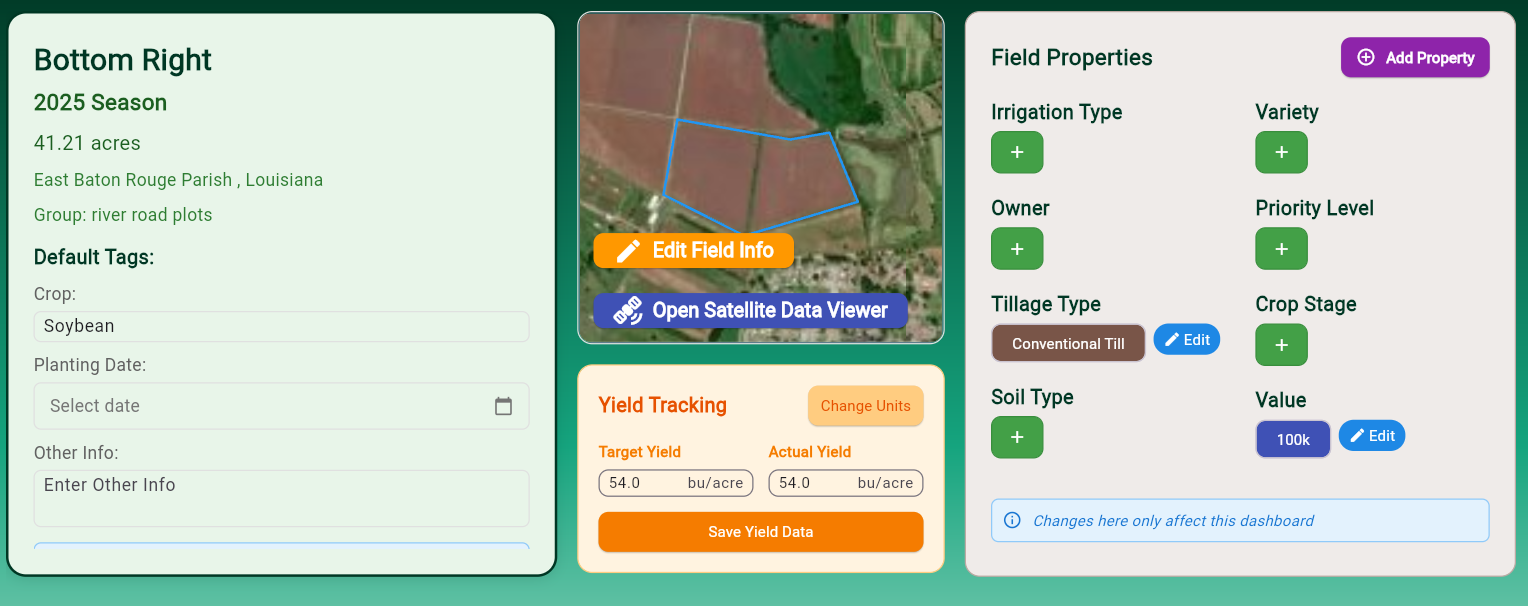
Season dashboards organize all of your field and cost information per-field, per-season in one convenient place. To create this dashboard, on the dashboards page, press 'Create' and then select your field and the 'Season Dashboard' option. Or, you can click your field on the maps page and select 'Create/View Dashboard' and then select the season that you'd like.
Field Properties and Yield Tracking
Use the field properties (which will be auto-populated from your current field) to organize your tags from a season-by-season basis. For instance, if your variety or crop changes from season to season, you can track it here. Yield data will be automatically populated by the crop based on local average data, but you should put in your target and actual yield for higher accuracy. This yield widget will have direct affects on your finances.
Master Field Timeline
Here, you can see all of your rain events and field notes that reference this field for the selected season. You can filter what appears on this timeline and set thresholds for different rain events so they do not clutter the timeline.

Field Balance Sheet
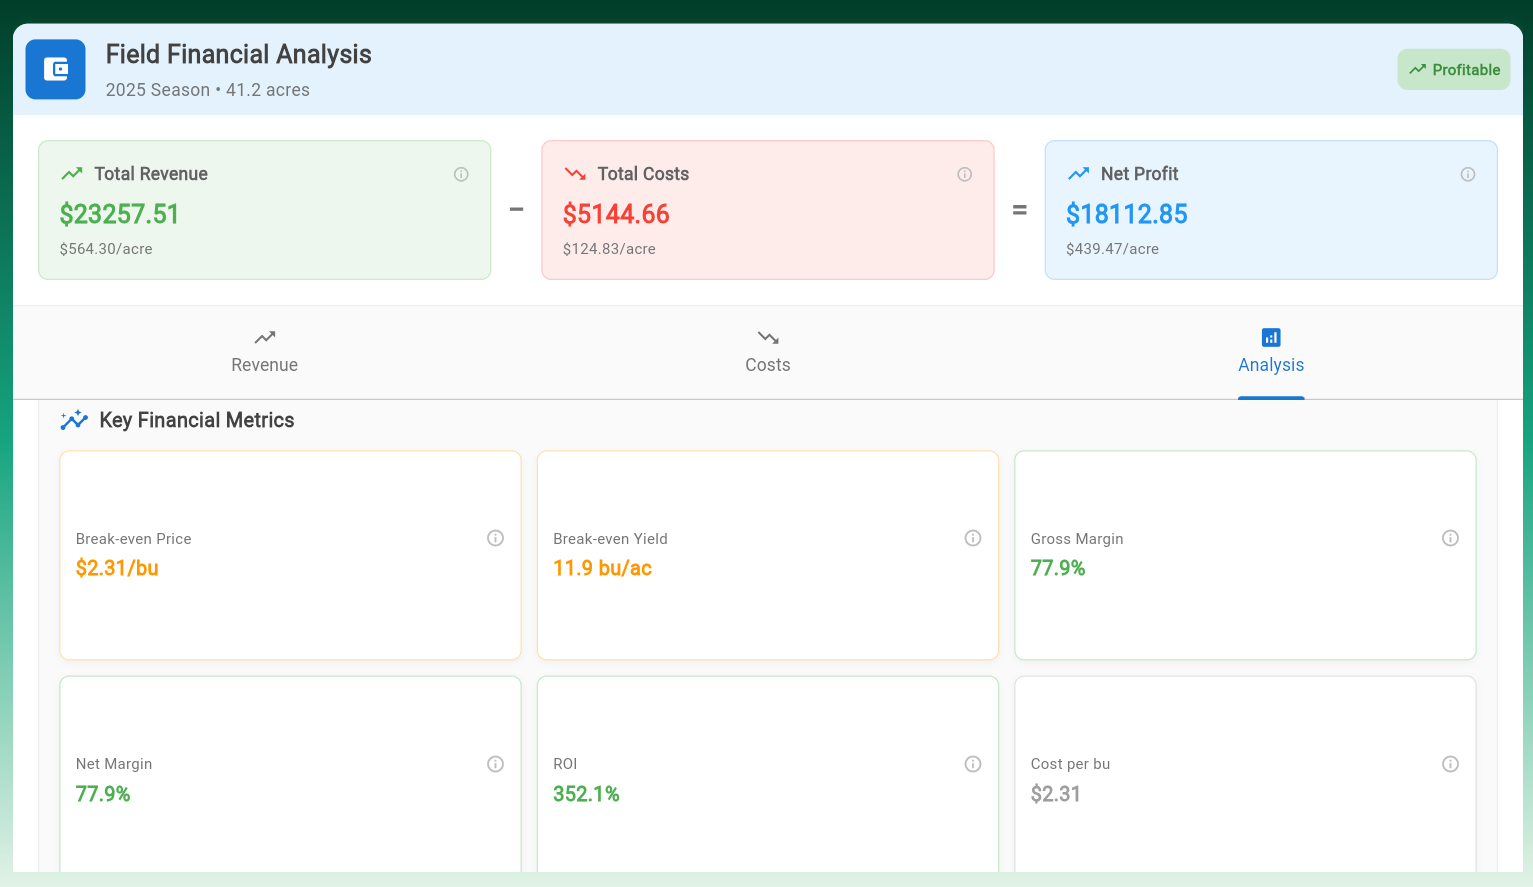
Here is the core of all of your field finances: the field balance sheet. There are three sections to this balance sheet, those being revenue, costs, and analysis. Click between the different sections to access them, or you can swipe right or left on mobile devices.
The revenue section is pretty self-explanatory. Put in the cash price for your crop in $/unit and the revenue is automatically calculated based on your field acreage. Revenue is calculated based on your actual yield in the yield tracking widget.
Adding Costs
You can add costs to this field by pressing the 'Add Costs' button. A dialog will pop up with some default categories and prices, feel free to choose one of those and change the price or create your own cost. Once added, you can specify if this cost is a per-acre cost or if it is a per-quantity cost.
For instance, if you have 3 scouts each costing $20 of labor, you can record a flat cost of 60, or you can specify a cost of $20/scout and 3 scouts. Another example would be a pesticide 5 gal/acre application costing $3/gallon. To record an application for the entire field, input $3/gallon, an application rate of 5, and check the per-acre box to multiply it by the field acreage.
One of the best parts of the balance sheet is that you can use AI to analyze all of your field costs and metrics to identify anomalies and find places to improve, saving you money and increasing your bottom line. All you have to do is press the 'Analyze with AI' button!
Farm Futures Analysis
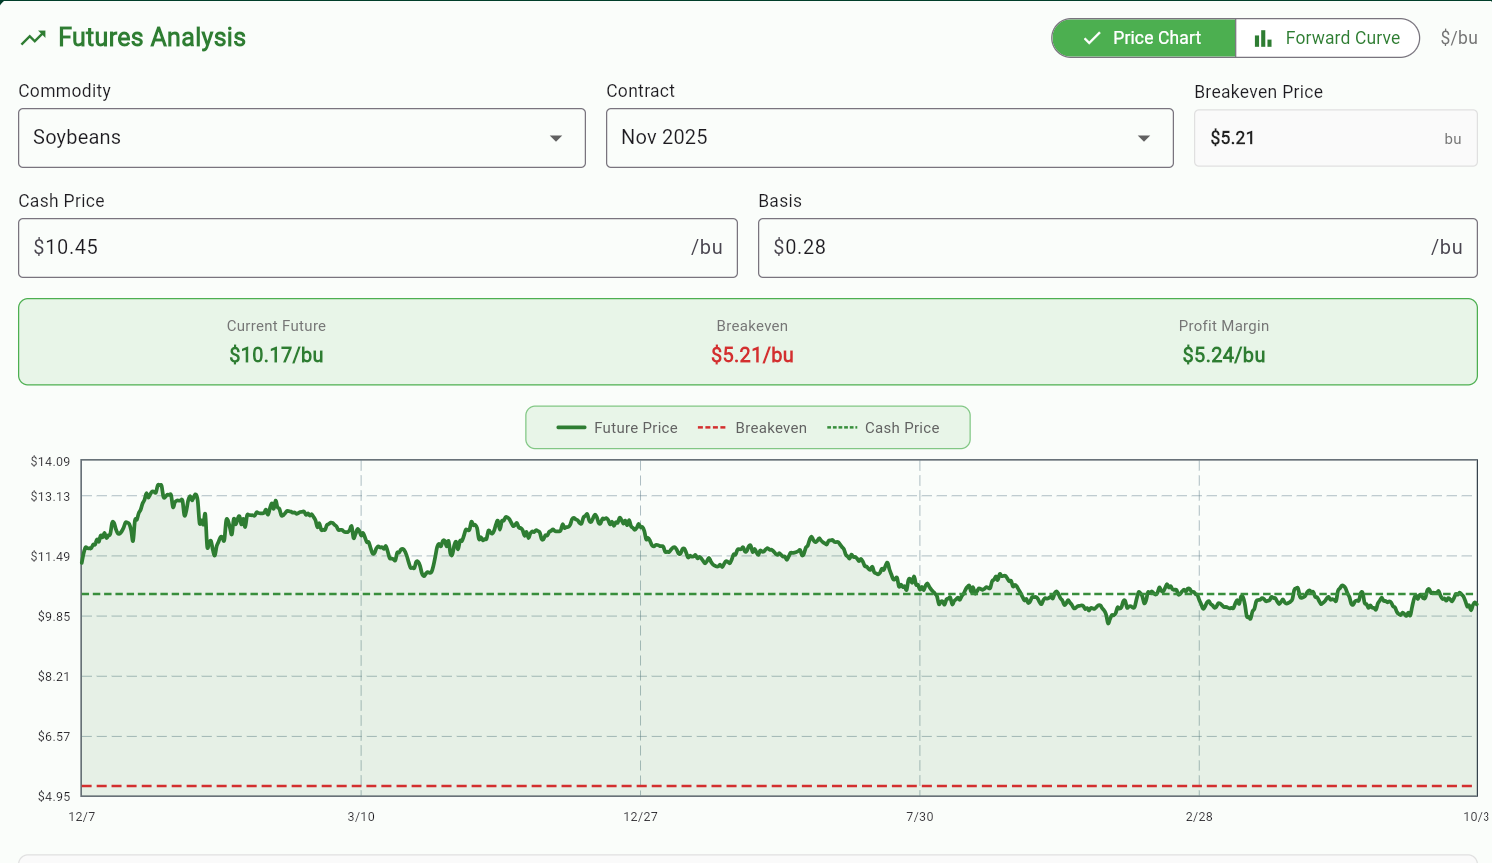
Here, you can see the futures prices over time for different active contracts and commodities. The cash price is automatically pulled from the balance sheet and the basis is calculated based on the futures price and the cash price. The breakeven and cash price are shown as horizontal dotted lines so that you can compare them to the current futures price. If you'd like to compare the current prices of different contracts, you can select the 'Forward Curve' option. Futures prices are updated once at the end of day.
Weather, Growth, Soil, and Elevation Analysis
At the bottom of the dashboard, you will see 4 tabs where you can further analyze what's going on in your field:
- Weather Analysis: View the weather and accumulation of precipitation, temperature, wind speed/direction, predicted soil moisture, and more.
- Growth Analysis: Predicts the current growth stage of your crops by calculating the Growth Degree Units (GDUs) using temperature data and thresholds.
- Soil Analysis: Uses different models to predict the soil composition of your field automatically.
- Elevation Analysis: Uses USGS data to figure out the max/min elevation throughout your field.