FarmMind Tutorials
Data Visualization
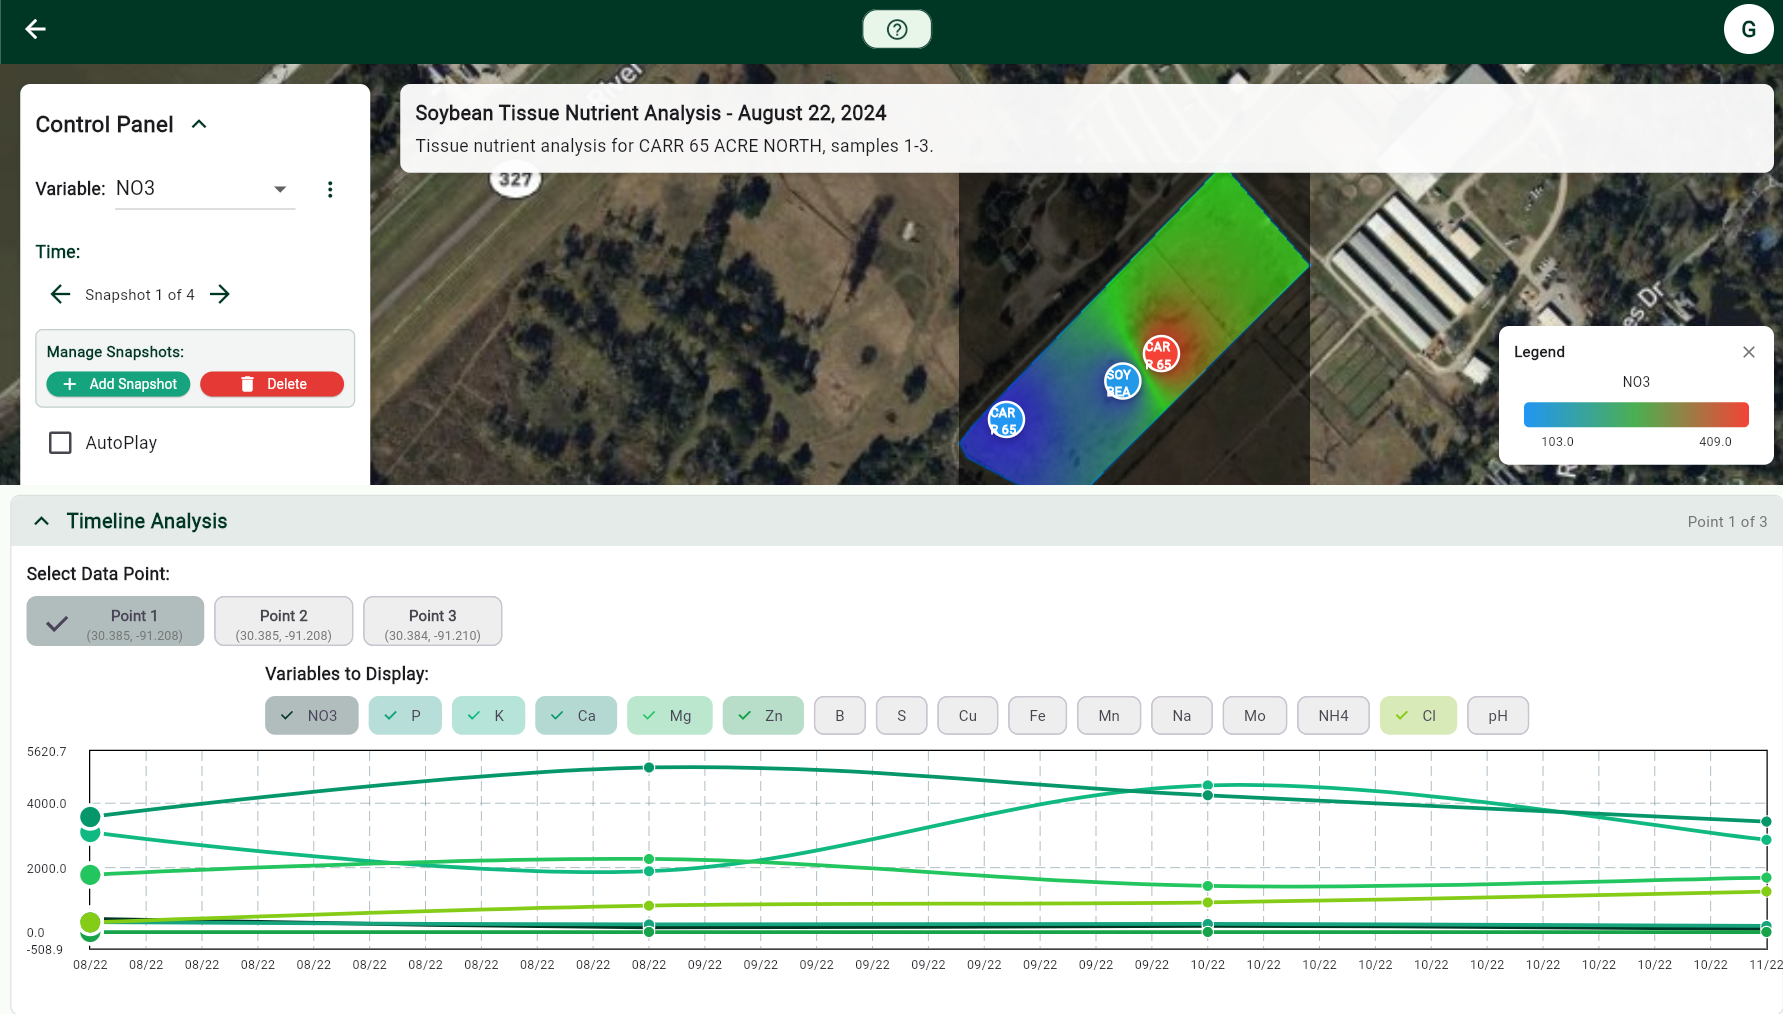
Data Visualization allows us to turn any type of space or time variant data into a heat map or temporal graph. Some information, such as elevation, soil parameters, weather, and NDVI are automatically pulled from different sources and can also be displayed in the satellite visualizer.