
FarmMind Tutorials
Time Varying Visualizations
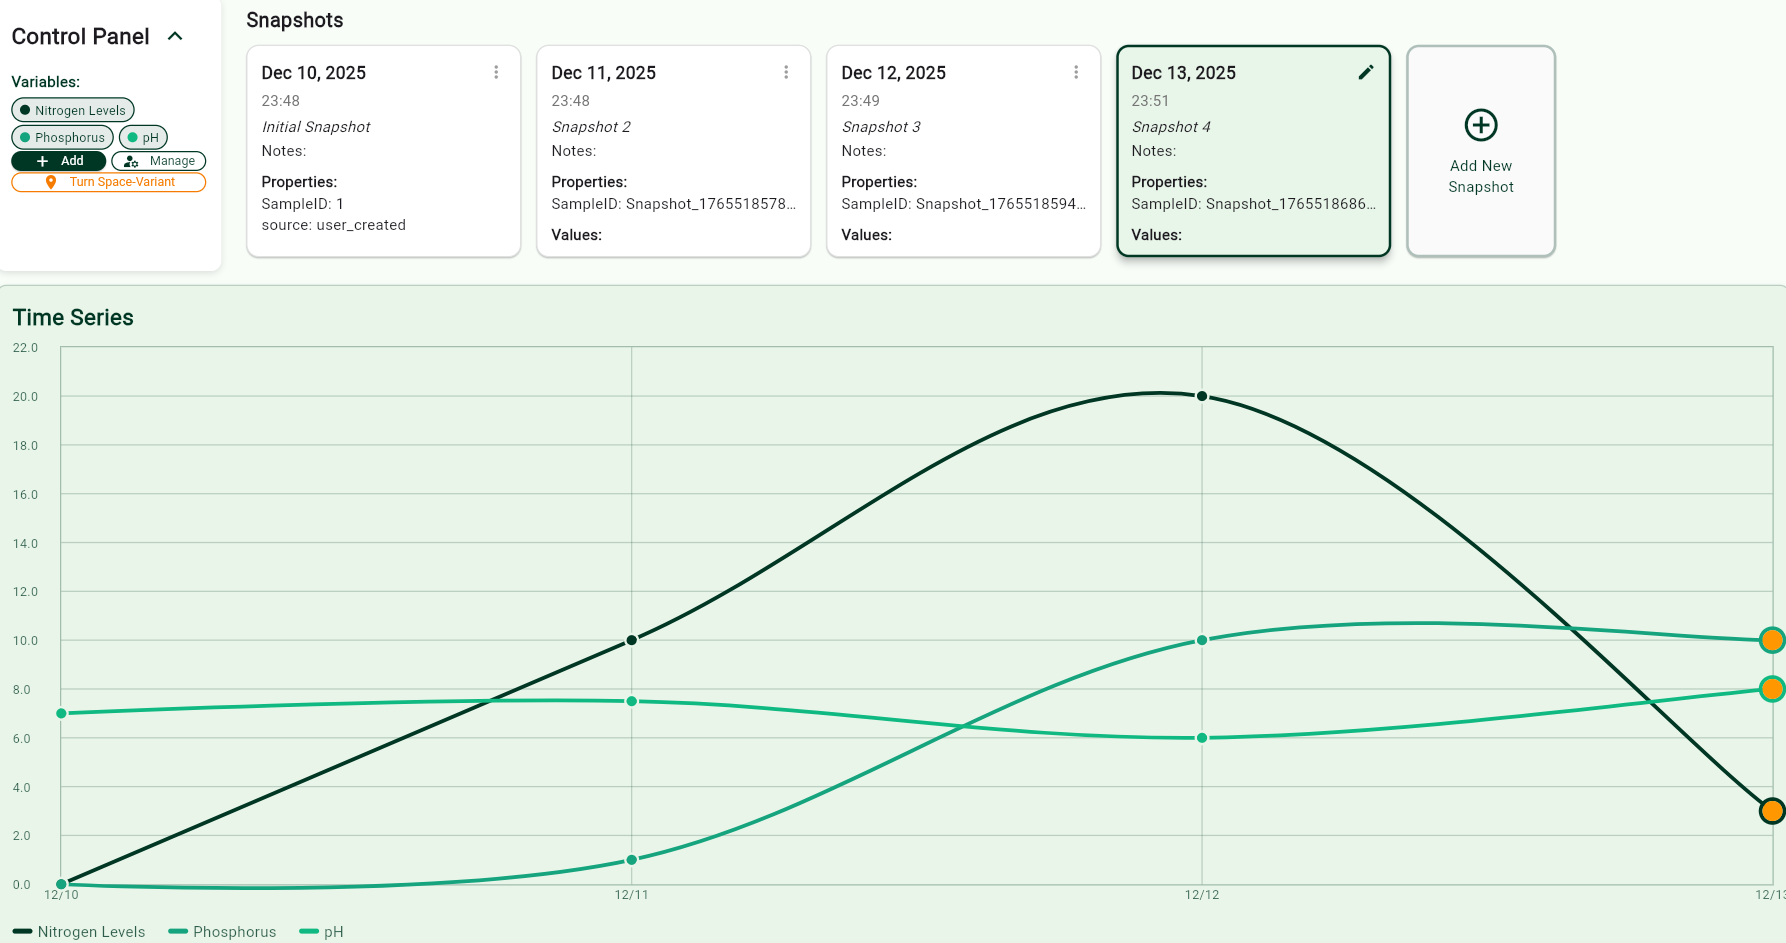
Time varying visualizations are essentially a graph with multiple variables over time. These can represent a sensor's readings over time, nutrient levels over time, or really anything over time.
Creating Snapshots
If you started with a blank visualization, create a new snapshot by pressing the plus button at the top. For each snapshot, you can add values for each of the variables and specify a time/date that the snapshot occurred.
You can add or manage the variables in the top right corner in the control panel. You also have the option to turn the visualization time-space variant.