FarmMind Tutorials
Space Varying Visualizations
Space variant data can represent all sorts of different types of information about your field. Examples include infestation rates varying in your field, varying nutrient rates in your field, or sensor data distributed in your field.
Creating a Blank Visualization
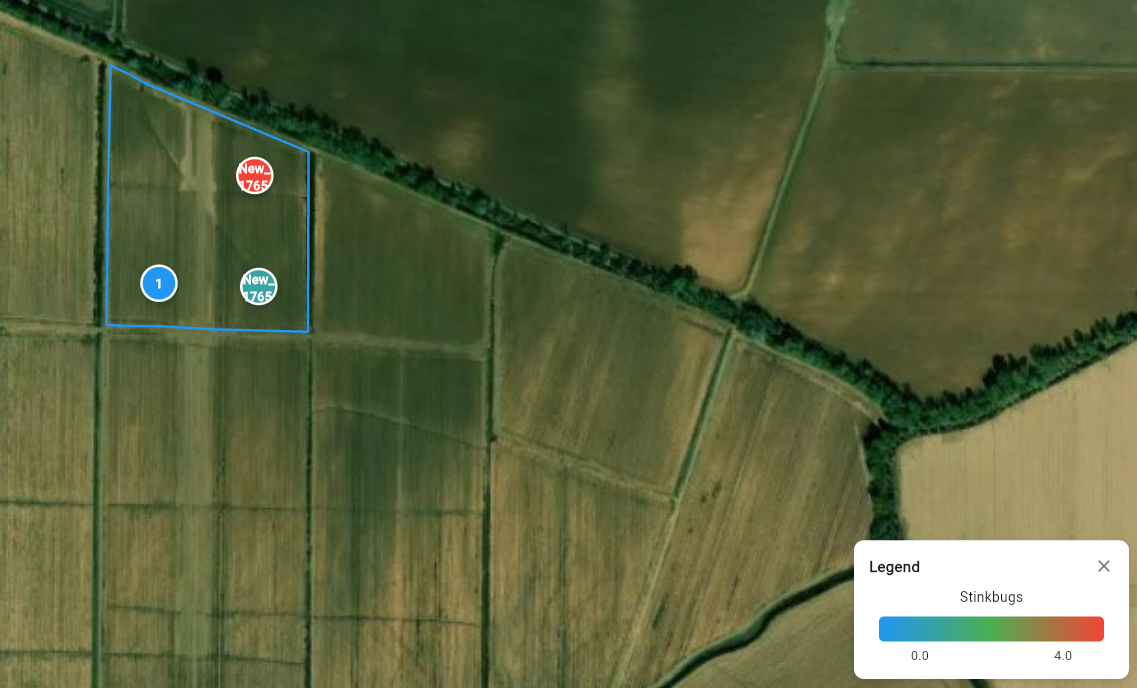
Let's start with a blank visualization. If you want to upload a document, make sure that it is space varying (either over a number of samples). Whenever you create a blank visualization, you will see your field with a node.
In the point editing tab on the left, click 'edit points', and then you can drag your points to the correct position. You can click on the map to add another point, which will pop up a dialog where you can input the data for different variables. Whenever you're finished, click 'exit editing' on the left side.
In the top left, you will see a variable dropdown. Here, you can switch between different variables to see how data changes from one point to another.
Interpolation
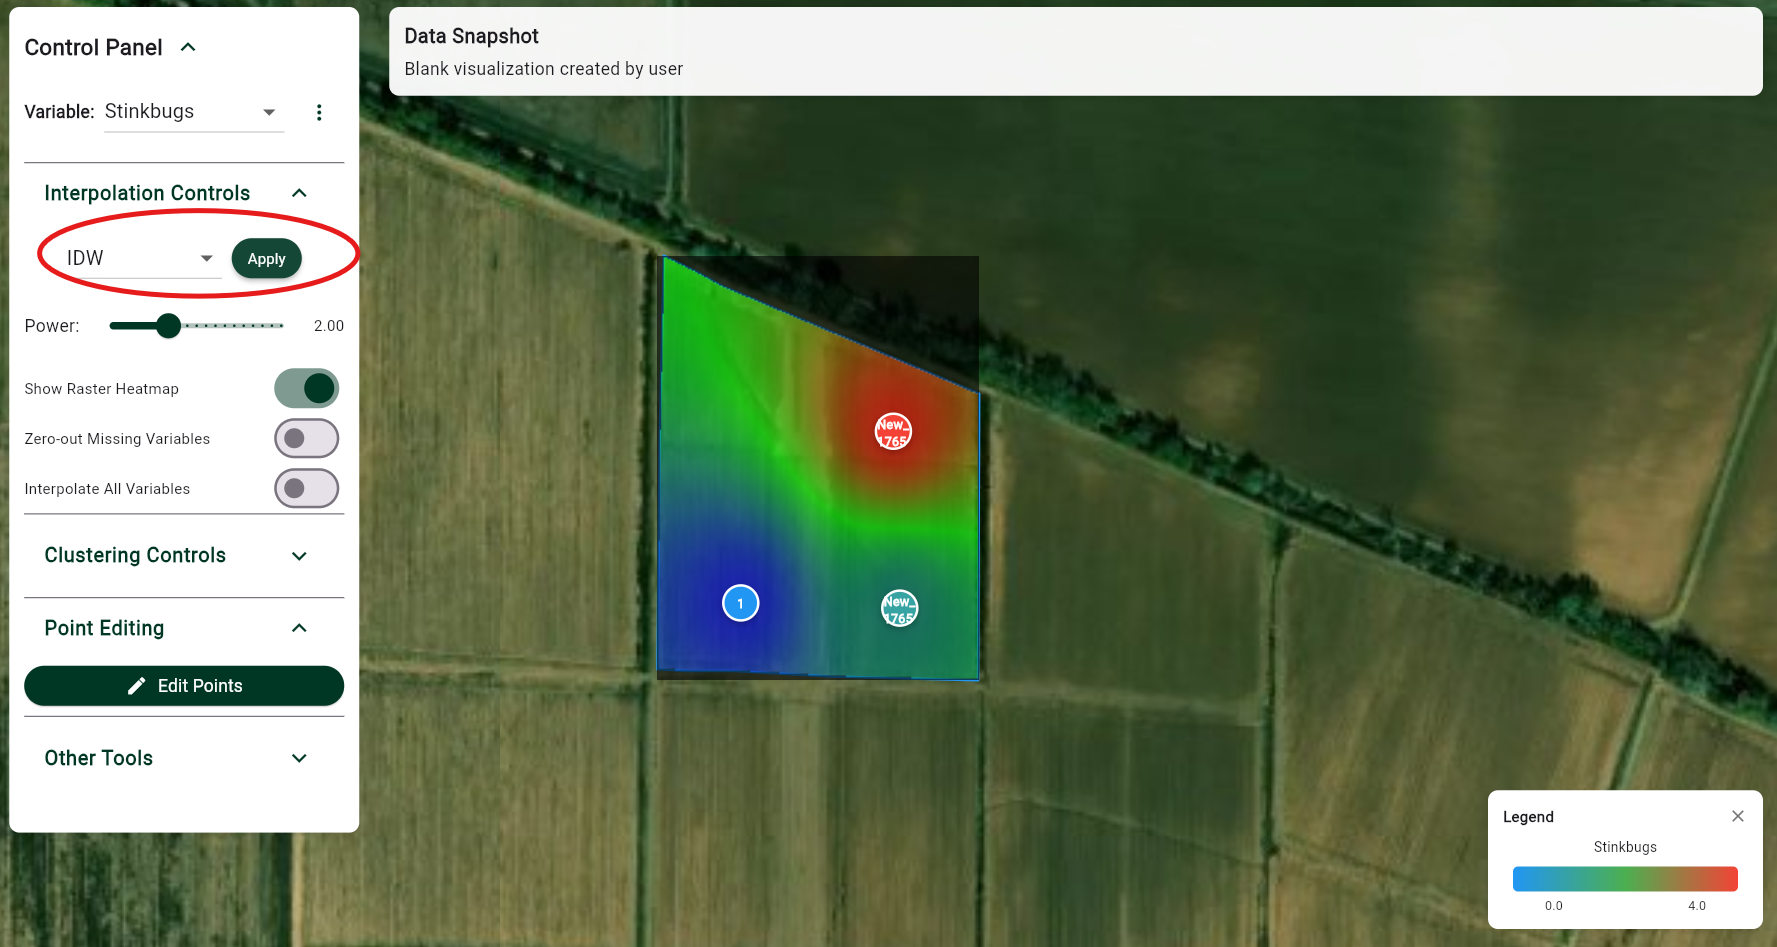
To see a distribution of data at every point in your field, you can interpolate your data by clicking the 'Apply' button under interpolation controls. You can select interpolation methods of IDW or Kriging.
You can adjust the parameters of interpolation, such as power for IDW or range for kriging using the slider and then reapplying. Interpolation does not automatically affect all variables. If you would like to apply it to all variables, then press the toggle below.
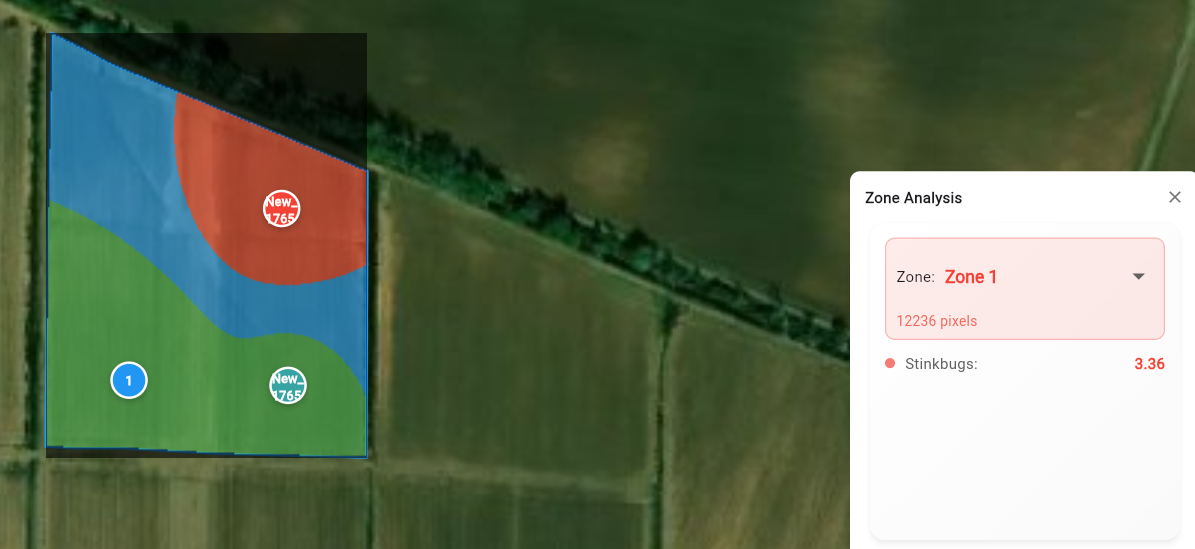
Clustering
Once you have interpolated your values, you can cluster your field into different zones. To do so, open the clustering tab in the control panel and select the number of zones and then hit 'Cluster Zones'. Clusters will take into effect all interpolated variables.